Showing posts with label Spiral Calendar. Show all posts

Wednesday, August 11, 2010

WARNING: Crash of Western Civilization may lie dead ahead...

Bookmark and Share
Print


A rather clear cyclical picture has developed with regard to wave patterns in mass mood and astroharmonics that strongly suggests the end of Western Civilization as-we-know-it will occur between now and October.

World stock markets are starting to rollover and the DJIA might have just turned down into wave-3 of Primary wave-3 down in the Grand Supercycle bear market according to the Elliott Wave count.


In fact, today Robert Prechter put out a special interim report highlighting his view that we just reached the key turning point that's been anticipated for weeks at Elliott Wave International:


***SEE ROBERT PRECHTER INTERVIEW ON BLOOMBERG***


Accordingly, a rapid 90%+ plunge in the stock market might unfold from here:


It appears the new moon today may be the tipping point in mass mood between euphoria and dysphoria in the wake of the "Cardinal Climax" astroharmonic extreme Arch Crawford has been warning the world about this summer:


This turning point may prove comparable to the August new moon peak in mass mood after the Harmonic Convergence in 1987 just before the historic crash into October 19th of that year. If a parallel cyclical pattern is unfolding here, then the brunt of the 'Apocalypse Wave', i.e., the crash of Western Civilization, could occur between now and the October 7th new moon this year, i.e., during the next two lunar cycles.

The seasonal pattern for mass panics to develop during the Autumn has been well identified:


In the historic 1987 crash the stock market and associated mass mood peaked around the time of the August new moon and then collapsed into just before the October new moon, i.e., into the 28th day of the 7th lunar month, which this year is October 4th. (Also, as I noted in my thesis, the closest the world ever came to an East/West nuclear war was into this time frame on the lunar calendar during the October 1962 Cuban Missile Crisis and October 1973 Yom-Kippur Arab-Israeli War.)

Importantly, Chris Carolan, who identified the 'Autumn panic calendar phenomenon', years ago identified October 2010 as a likely point for a low in mass mood based upon the "Spiral Calendar" he developed:


Thus, in the wake of a possible "Cardinal Climax" August new moon peak in mass mood, there's the possibility of a '29/'87 style crash into October. This time around, however, the 'panic' should be of "Grand Supercycle" scale which means that it is apt to be many times more potent than these prior breakdowns in mass e-motion (energy in motion).

Obviously, this is where the threat of man's destructive mood taking the form of global war looms large. Given this possibility, we are now entering a period where people need to seriously consider and start planning to "bug-out" from modern civilization because it might not be around much longer.

Then I heard another voice from heaven say:
"Come out of her, my people,
so that you will not share in her sins,
so that you will not receive any of her plagues;
for her sins are piled up to heaven,
and God has remembered her crimes."
[Revelation 18:4-5]


Meanwhile: Russia Ready to Launch Iranian Nuclear Power Plant

Thursday, December 17, 2009

The Lunacy Of Man

Bookmark and Share
Print
My thesis, "Manic-Depressive Man", exposes the insanity of human nature. In light of this, in recent months the synchronicity between lunar cycles and fluctuations in mass mood as reflected on Wall Street is quite impressive:


What is the point?

Maybe that the Creator is the true author of history, not His creatures.

Fittingly, today I was banned from the TickerForum.org web forum for noting that 'irrational exuberance' from the Elliott Wave Primary Wave 2 rebound in the Grand Supercycle bear market might have peaked with the 12/16/09 new moon, which is a Spiral Calendar F25 new moon anniversary of the 10/22/87 panic extreme new moon.

Now we are heading toward a full moon lunar eclipse on New Year's eve that coincides with an informal deadline for Iran to agree to U.N. demands regarding its clandestine nuclear weapons program or face stiff economic sanctions. Thus, the phenomenon I've been pointing out for many years regarding "Kremlin Astrology" may prove relevant.

The bottom line is that man as a species is utterly insane and out of touch with reality, and thus constitutes a danger to himself and the world he inhabits. Until humankind is willing to accept The Truth, there is no hope.

Period.

Friday, December 04, 2009

1929-1987-2009 Analogy Update

Bookmark and Share
Print
In an October blog I highlighted the work of Jim Ross who noticed the similarity of the stock market patterns in 1929, 1987 and 2009 and how the timing was specifically related using Chris Carolan's Spiral Calendar. The implication was that, if the analogy were to continue, stocks would peak around October 16th and then crash into December 10th or thereabouts:


Generally the stock market did peak into Monday, October 19th....the trading day after October 16th....as can be seen in the Russell 2000 and other such broader market indices:


But the widely watched stock indices like the DJIA continued to trend higher after October 19th and this morning the Dow reached an intraday high in the rally that's been underway since March:


Then a sharp reversal hit the market with the DJIA closing down more than 80 points.

If the 1929-1987-2009 analogy is still relevant, which seems highly unlikely at this point, then this suggests some sort of massive panic is going to unfold between now and the next new moon on December 16th.

As noted in my November 19th blog, fluctuations in the stock market have been in sync with the lunar cycle in recent months. Instead of peaking out with the new moon on November 16th, however, there was a phase shift and mass mood held up until the full moon this week (12/2). In the context of the 1929-1987-2009 analogy, Tuesday's full moon is parallel with the full moons on October 18th, 1929 and October 7th, 1987 (see blue arrows below) after which the brunt of the stock market crashes unfolded into just before the subsequent new moons on November 1st and October 22nd, respectively, in those infamous years. Thus, if the historical analogy is to continue, a dramatic collapse in mass mood would occur from here.


That something significant is in store for the December 10-12 period is further reflected by the discovery of market analysts Roy Fellars and Kevin Murphy:


What seems most plausible at this point is that the peak of the Elliott Wave Primary Wave 2 rebound will occur into December 11th (12/12 is a Saturday), but it's possible, although seemingly very unlikely, that some sort of crash will unfold next week.

If there is a mass panic in the days ahead, hopefully it will be constrained to financial affairs. However, as noted in my thesis, it's possible that a collapse in investor confidence could be associated with a geopolitical shock of some sort. In this regard, the crisis over Tehran's nuclear pursuits should be closely watched since an Israeli strike on Iran would likely trigger what I foresaw in my apocalyptic vision.

Notably, if a panic holds off by one more lunar cycle from here, then the relevant full moon will be December 31st, which is a lunar eclipse just before a solar eclipse on January 15th and therefore marks a Puetz crash window. This might prove all the more relevant given that there's an informal deadline for Iran to reach an agreement to halt it's nuclear pursuits by year-end according to the Obama Administration. In this regard, also bear in mind Kremlin Astrology.

As for why any of this is relevant from a Christian perspective, it's a matter of establishing that God, not man, is authoring human history given that God put the sun, moon and planets in motion to shape our collective e-motion.

Thursday, November 19, 2009

Crash into early-December?

Bookmark and Share
Print
The stock market is cycling a half lunar cycle off of the 1929 and 1987 patterns as overviewed in my 10/14 blog. The crashes in '29 and '87 occurred between the full moon and new moon in the latter half of the second lunar cycle following a new moon top.

The equivalent new moon top this year occurred around the Oct. 18th new moon (10/19 top in broad market indices). The first lunar cycle has completed with the new moon on 11/16 and this had been associated with a secondary high in mass mood with the DJIA and other key indices reaching all-time highs while the broader market has not.

We are now into the second lunar cycle after the top using the 29-87-09 analogy. This is the cycle when the crashes occurred in '29 and '87 following the full moon. As shown below, recent correlation between mass mood and the lunar cycle suggests a low into the full moon instead of the next new moon. If so, this suggests the possibility of a crash into the upcoming full moon on Dec. 2nd. If a collapse in mass mood lasts until the next new moon, this would run until December 16th. (Note that the full moon December 2nd falls six weeks before a solar eclipse on January 15th, 2010, so there's a 'Puetz eclipse crash window' from November 26th - Thanksgiving - to December 5th. Maybe "Black Friday" will be a major disappointment?)


Carolan.org


MarketOracle.co.uk


For those who are doubtful of lunar effects on mass mood and the stock market, read the following:

The Lunar Cycle and Stock Returns

Autumn Panics: A Calendar Phenomenon

The Spiral Calendar: Chapter One

Wednesday, October 21, 2009

Is something about to give?

Bookmark and Share
Print
As projected in my prior blog, the DJIA does appear to be forming a top above Dow 10,000 in association with the Spiral Calendar anniversaries last week and Friday's F25 Spiral from the 1987 top in particularly.


The climax of mass optimism associated with the Primary Wave 2 rebound from the March lows appears to have occurred yesterday, October 19th (the 22nd anniversary of the 1987 'Black Monday' stock market crash) when the DJIA closed at 10,092 (F25 +1 in Spiral Calendar parlance). We'll soon see if that closing high marks the final top of this Grand Supercycle bear market rally. If it does, then we should now be rolling over into Primary Wave 3 down which, as I've been warning all year, could involve the crux of the collapse of Western Civilization.

This is where the phenomenon I've identified concerning reversals from psychologically important thousand marks may come into play. As overviewed in my thesis, there is a tendency for 'historical shocks' to erupt upon reversing from thousand mark thresholds in the DJIA.

One of the most blatant examples of this phenomenon occurred in 1990 when the DJIA approached the 3000 mark for the first time in history. On July 16th and 17th of that year the DJIA closed two days in a row at 2999.75, not closing above that psychologically significant mark until the following year. On July 17th of 1990, Saddam Hussein made a speech threatening Kuwait. A few days later Iraq started massing troops on the border with the Kuwaiti Emirate and the stock market slipped 5 percent. Then, on August 2nd, 1990, Saddam's Iraq invaded Kuwait precipitating a further 20% drop in stock prices. Thus, rather precisely with the DJIA peaking out and reversing from the 3000 mark, a Persian Gulf Crisis erupted precipitating a 25% drop in the stock market:


Another disturbing example of this historical correlation occurred when the DJIA reversed from Dow 10,000 in early-September of 2001. After this reversal, 9/11 occurred:


Are we about to see this pattern repeat here with a reversal from Dow 10,000?

It's a distinct possibility, and, given that the next wave down in mass mood should entail Primary Wave 3 down in the Grand Supercycle bear market, a very serious crisis could be about to occur. Again, my greatest concern is that this will have something to do with a new conflict in the Middle East involving Iran that will ultimately precipitate World War Three as I foresaw more than 18 years ago during the first Gulf War.

Thursday, October 15, 2009

Dow 10,000 & The Spiral Calendar

Bookmark and Share
Print
The DJIA closed today just above the psychologically important 10,000 mark:


As I have been pointing out for years, there's a tendency for the stock market to top out around psychologically important thousand marks and, upon reversal, major historical shocks can occur.

Chris Carolan's Spiral Calendar has been pointing to this timeframe for a potential emotional extreme:


While I was concerned that this extreme would take the form of a mass panic potentially involving global war, fortunately we are instead seeing an extreme of collective optimism.

Are we now at the anticipated Primary Wave 2 top of the Elliott Wave Grand Supercycle bear market?


It's certainly likely.

Obviously the tendency for panic lows into the days around Tishrei 25 on the Hebrew calendar is misleading this year. Instead, the relevant force is the Spiral Calendar that predicts the non-linear periodicity between emotional highs and lows of Elliott Wave patterns in human history.

The Spiral Calendar is based upon the Fibonacci series and lunar cycles. It was discovered by Chris Carolan as he examined the correlations between the 1929 and 1987 stock market crashes:


While one aspect Carolan uncovered was the tendency for autumn panics in financial markets, another key pattern Carolan noted was that there was a specific time interval between the 1929 and 1987 stock market crashes predictable based upon the number of lunar cycles between the two historic events. More specifically, Carolan noted that the 1929 and 1987 stock market crashes were separated by 717 lunar cycles where 717 is the square root of the 29th number in the Fibonacci series.


The Fibonacci series is generated such that each number in the series is the sum of the two prior numbers in the series. Thus, if you start with 1 as the first number, you get the following series: 1, 1, 2, 3, 5, 8, 13, 21, 34, 55, 89...

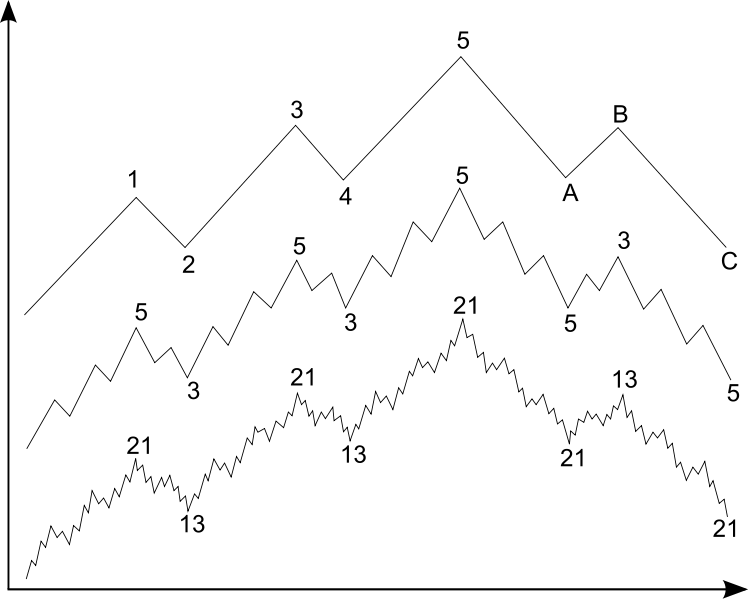
This series is relevant in Elliott Wave analysis because the wave pattern discerned by Ralph Elliott is fractal-based with Fibonacci relationships:


The 29th number in the Fibonacci series (1,1,2,3,5,8,13,21,34,55...) is 514229. The square root of 514229 is 717.0976. This is the exact number of lunations (lunar cycles from new moon to new moon) between the 1929 and 1987 stock market tops and crashes. More specifically, 717.096 mulitplied by 29.5306 (number of days in a lunar cycle) is 21176, the number of days between the 1929 and 1987 tops and subsequent panic lows (+/- 1 or 2 days) where the tops occurred on 9/3/29 and 10/25/87 and the subsequent panic extremes occurred on October 28/29 of 1929 and October 19th of 1987, respectively.


As Jim Ross has uncovered, Carolan's Spiral Calendar may be very relevant now because 2009 is proving to be analogous to 1929 and 1987. The 25th number in the Fibonacci series is 75025 of which the square root is 273.9. This number of lunations is equivalent to 8088 days. This is the time interval between the 1987 top and Friday, October 16th. (Notably, this time interval is a 38.2% of the time interval between the 1929 and 1987 tops where .382 is equivalent to 1.618 to the minus 2 power and 1.618 is the Fibonacci Golden Ratio, Phi, which is the ratio of two consecutive numbers in the Fibonacci series the further out you go, e.g., 55/34 is ~ 1.618.)


Are we about to see a top as significant as the 1929 and 1987 tops? Will this be followed by a major panic like occurred in those previous years? This is possible. Look at a chart comparison:


Here's the key dates pinpointed by Jim Ross using the 1987-2009 Spiral Calendar analogy:


If this analogy continues, the stock market would top here above Dow 10,000 and then a collapse would occur into December 10th of this year, the equivalent of October 19th, 1987 and 10/26/1929....approximately the time of the '29 Crash.

Notably, as is apparent from my prior related blog, a crash low into 12/10 is not consistent with the seasonal pattern for mass panics which typically climax around Tishrei 25 on the Hebrew calendar. Thus, I consider a crash into early-December a low probability forecast, but we'll see if the parallel pattern continues in the days and weeks to come. (Note that Chris Carolan is doubtful as well.) At the least, a major peak above Dow 10,000 in the days ahead seems to be a reasonable expectation and in its wake Primary Wave 3 down in the Grand Supercycle bear market should ensue with potentially biblical implications for human history.

Wednesday, September 30, 2009

Who Authors Human History?

Bookmark and Share
Print
I believe we may now be entering a very important juncture in human history.

The DJIA recently reversed from the psychologically important 10,000 mark:


This may have been, or will soon be, the peak of an Elliott Wave Primary wave-two in a Grand Superycle bear market:


Mid-October will see a significant cluster of Spiral Calendar anniversaries that suggests some sort of extreme in mass emotion lies dead ahead:


You can add to that chart above that October 16th is a significant F25 Spiral Calendar anniversary of the August 1987 top before that year's crash. The Spiral Calendar, derived from lunar cycles and Fibonacci-based periodicity, pinpoints extremes of mass emotion based upon the timing of past extremes of mass emotion.

While Chris Carolan has been looking for a top into October 9th, it's possible the stock market and mass mood already topped and there will be a mass panic into that window of time.

Note that the week of October 11-17 will involve the "Dark Days" of autumn identified by Carolan as the most likely point during the year for panic climaxes to occur:


Note that last year the implied volatility index, which is a gauge of overall fear on Wall Street, also climaxed into the 28th day of the 7th lunar month during last year's financial crisis:


This phenomenon can be more accurately ascertained by looking up the dates of key panic climaxes (including maximum DEFCON nuclear alerts in October of 1962 and 1973) using a lunar-based Hebrew calendar converter:

13 October 1857 = Panic of 1857 = 25th of Tishrei, 5618

24 September 1869 = Black Friday in 1869 = 19th of Tishrei, 5630

29 October 1929 = 1929 Stock Market Crash = 25th of Tishrei, 5690

23 October 1962 = Cuban Missile Crisis = 25th of Tishrei, 5723

Wed, 24 October 1973 = Yom Kippur Arab/Israeli War = 28th of Tishrei, 5734

Mon, 19 October 1987 = 1987 Stock Market Crash = 26th of Tishrei, 5748

Tue, 28 October 1997 = 1997 Asian Financial Crisis = 27th of Tishrei, 5758

Fri, 24 October 2008 = 2008 Financial Crisis = 25th of Tishrei, 5769

Tue, 13 October 2009 = 25th of Tishrei, 5770


This year the week of October 11-17, which is equivalent to Tishrei 23-29, is the typical period for a panic extreme, so we are now nearing the time of year most vulnerable to mass hysterias. Again....this may take the form of global war.
Related Posts with Thumbnails